
One would have to search far and wide these days to find a single informational text written for a K–6 audience that does not contain one or more graphical elements. Graphical elements — labeled diagrams, timelines, tables, and so forth — are increasingly ubiquitous. There is also evidence that graphics in children’s texts are increasing in their diversity, complexity, and importance. As a case in point, a recent analysis of 276 science and social studies textbooks, leveled readers, and trade books appropriate for second and third graders revealed that 60% of the 12,238 graphics in these texts provided additional information not included in the written text (Fingeret, 2012). Numbers like these leave little room for doubt that students who know how to decode and interpret graphical elements have a distinct advantage over those who do not.
The Common Core State Standards (CCSS; National Governors Association Center for Best Practices & Council of Chief State School Officers, 2010) have recognized the importance of graphical comprehension via explicit reference in several of its anchor and grade-level standards. However, despite the prominent role that graphical literacy plays in the CCSS and the nearly universal inclusion of graphics in texts created for young children, there is surprisingly little published research on instructional approaches to teaching children how to comprehend or produce graphics.
Although we certainly favor the use of research-tested practices, we cannot wait to begin instruction in this important area until published research catches up. Instead, for the moment, we should rely on research related to instructional interventions with written text and the research on children’s graphical literacy development to inform our instruction on graphical literacy. In this article, we first discuss what we need to teach students about graphics, particularly graphics in informational text, and then discuss how we might teach them effectively.
What do students need to know about graphics in written text?
The CCSS, adopted by 45 states, place considerable emphasis on visual texts. The anchor standards, for example, call for students to do the following:
- “Integrate and evaluate content… visually and quantitatively, as well as in words” (Reading: 7)
- “Make strategic use of… visual displays of data to express information and enhance understanding of presentations” (Speaking and Listening: 5)
- Apply the reading anchor standards to texts that include “information displayed in graphs, charts, or maps” (Range, Quality, and Complexity of Text: 10)
In addition, 30 individual grade-level standards explicitly mention graphics, illustrations, or the role of illustrators. Here we identify some fundamental concepts and specific understandings about graphics that are entailed in these standards.
Concepts of graphics
When children are learning to read, they develop concepts of print, or foundational understandings of what written texts are and how they work (e.g., a word is a discrete unit of language; readers of English usually read from left to right and top to bottom). At the same time, children may also be developing a parallel set of concepts related to understanding graphics (Duke et al., 2009). These concepts of graphics appear to include, but are not necessarily limited to, the concepts of action, extension, importance, intentionality, partiality, permanence, relevance, and representation (see Table 1 for an explanation of each). Our work with pre-K through third-grade children suggests that most children acquire many of these concepts quite early.
Table 1: Concepts of graphics with definitions
| Concept | Definition |
|---|---|
| Action | Static graphics can be interpreted as dynamic action. |
| Extension | Some graphics provide additional information that is not present in the written text. |
| Importance | Some information in a graphic may be more important than other information. |
| Intentionality | Illustrators (who are sometimes also the authors) choose to create graphics to accomplish a communicative purpose within a larger text. |
| Partiality | Not everything in written text must be represented in the graphics. |
| Permanence | Graphics in printed texts are permanent and do not change. |
| Relevance | Graphics and written text are related. |
| Representation | Illustrations and photographs represent objects, but do not have the same physical properties as those objects. |
Note: From Duke, N.K., Norman, R.R., Roberts, K.L., Martin, N., Knight, J.A., Morsink, P., et al. (2009, December). Visual literacy development in young children: An investigation with informational texts. Paper presented at the annual meeting of the Literacy Research Association, Albuquerque, NM.
Figure 1 depicts the grade level at which all or nearly all of the children with whom we worked appeared to demonstrate an understanding of each concept. As this figure shows, there is some indication that even most preschoolers understand that a photograph of a child with his leg raised in front of him and a ball in the air depicts the action of kicking, not a tableau scene (concept of action).
Figure 1: Grade at which all or nearly all children demonstrated understanding of each concept
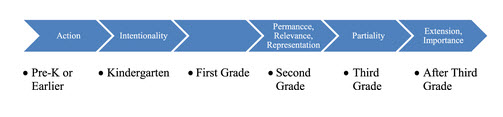
Similarly, while in the primary grades, the majority of children develop an understanding of most of the other concepts, such as the concept that authors and illustrators choose pictures intentionally and not solely because “they look fun,” as Eric (age 4, all names are pseudonyms) suggested (concept of intentionality). These understandings are essential because, just as concepts of print provide the foundational understandings that children need to effectively engage with written text, we believe concepts of graphics provide the foundational understandings needed to engage with the graphical elements of text.
Importantly, two concepts of graphics do not seem to develop fully in the primary grades, even by the end of third grade: extension and importance. Children who have acquired the concept of extension understand that graphics can provide information that is not stated in or cannot be inferred from the written text alone. For example, when shown an illustration depicting the necks and heads of several different birds, each eating a different type of food (Sill, 1997, p. 25) and read the words “Birds use their bills to pick up food,” Xander (age 5) explained that a child could also learn that “Birds are different colors. Their eyes can be different. Their beaks can be different colors, too, and long or short and wide or skinny. They can eat all sorts of things: fish, leaves, seeds, pollen, bugs….”
However, children like Xander are the exception rather than the rule. Few children (only about one third of preschool through third graders with whom we worked) seem to fully understand this concept, often reporting that there is nothing new to be learned from extending graphics. This is particularly problematic given the likelihood that graphics carry important meaning unavailable through the written text (Fingeret, 2012) and CCSS that expect students to glean that meaning (e.g., Reading Informational Text [RIT], 2.7: “Explain how specific images… contribute to and clarify a text.”).
Figure 2: Excerpt from Germs Make Me Sick! illustrating the concept of importance
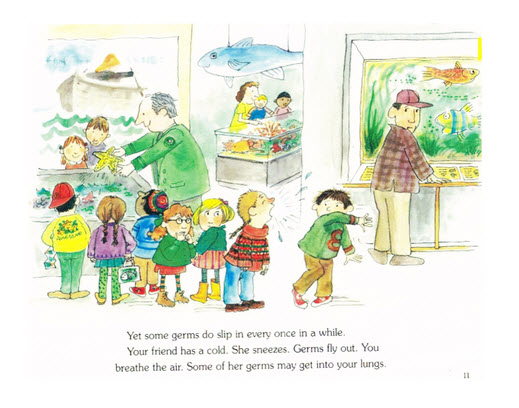
A second concept that appears to develop later than most is the concept of importance. For instance, when studying page 11 in Germs Make Me Sick! (Berger, 1995; see Figure 2), students who fully demonstrate the concept of importance identify the girl sneezing on the boy as the most important part of the picture. Children who do not demonstrate an understanding of the concept of importance typically report that no one part of the picture is more important than any other, or they identify other objects depicted in the picture, such as the fish tank in the illustration as most important. Only about one fourth of the children in pre-K through third grade with whom we have worked appeared to demonstrate full understanding of this concept. Again, this is problematic given expectations of the CCSS, as in the first-grade standard: RIT.1.7: “Use the illustrations… in a text to describe its key ideas.”
Knowledge of graphical devices
To gain full access to the content of informational texts, children also need to be able to decipher particular types of graphical devices, such as captions, cross-sectional and surface diagrams, flowcharts, graphs, insets, maps, tables, and timelines (please see Table 2 for definitions and examples of each). Research examining children’s abilities to read and use these graphical devices, however, suggests that mastering these skills is no easy task. Although children’s abilities to comprehend and use these kinds of graphical devices seem to improve with age or experience, in our work, even most third graders did not yet have a firm grasp of them. This finding is generally consistent with what little other research exists on the subject.
For example, although there is some indication that children can identify and understand certain aspects of maps, there is also evidence that many young children (kindergarten through second grade) have trouble understanding scale (Blaut & Stea, 1971). By the same token, research on readers’ understandings of graphs has found that both children and adults have trouble reading and interpreting them (see Shah & Hoeffner, 2002 for a review of this research), with young children often reading graphs as literal pictures (e.g., Kerslake, 1981).
Even among children in the same grade, there appears to be a great deal of variation in children’s knowledge and understanding of graphical devices (Duke, Roberts, & Norman, 2011). For instance, when first grader Ali was shown a table depicting several bugs, their number of legs and body parts, and whether they qualified as insects (Ripley, 2008) and asked what the table showed, he responded, “Different kinds of bugs and how many legs they have. The daddy long legs has one body part. It shows the number of body parts and if it’s an insect.” In contrast, another first grader, Malcolm, gave a much more simple response: “Insects.” This contrast in apparent depth of understanding was fairly consistent for these two boys across all devices.
The differences found among children at the same grade level, such as those illustrated by Ali and Malcolm, highlight the need for teachers to be prepared for considerable variation in how much and what types of support students need. Specific strategies for managing this variation are included in the following recommendations.
Table 2: Graphical devices with definitions
| Graphical device | Definition | Example |
|---|---|---|
| Captioned graphics | Illustrations or photographs accompanied by words, phrases, or sentences, separate from the running text. The words typically appear near but not within the graphic. Although some captions are so brief that they resemble one- or two-word labels (e.g., “The Titanic”), others are more lengthy and describe, comment on, or provide additional information related to the graphic. |  |
| Diagrams: Cross-section | Illustrations or photographs that include normally unseen interior portions of an animate or inanimate object or scene in which specific, individual parts are labeled. | 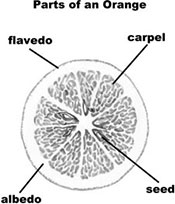 |
| Diagrams: Surface | Illustrations or photographs of the surface of an animate or inanimate object or scene in which specific, individual parts are labeled. | 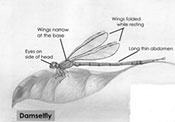 |
| Flowcharts | Graphical devices that depict the stages of a process in a chronologically ordered set of illustrations or photographs, typically connected by lines or arrows. |  |
| Graphs | Graphical devices that illustrate the relationship between two or more variables using points, lines, or differentiated parts of a whole (e.g., pie graph, line graph, bar graph). | 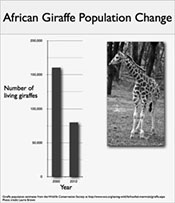 |
| Insets | Smaller pictures within or near larger pictures. They zoom in or out on the larger picture, highlighting something important in the larger picture. Often, the inset is a magnification designed to show something in the larger picture not easily visible to the naked eye. | 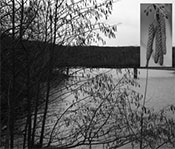 |
| Maps | Graphical devices drawn to scale to represent whole or part of a specific area. Maps can include symbols, a legend, and a scale. | 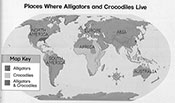 |
| Tables | Graphical devices containing columns and rows, whether labeled or unlabeled. Typically, tables give readers specific types of information (e.g., what an animal eats, where it lives, how it moves) about each of a series of related things (e.g., mammals: lions, camels, zebras, monkeys). | 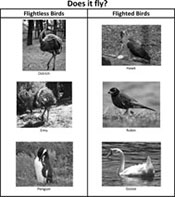 |
| Timelines | Graphical devices that identify specific historical events or epochs within a period of time, arranged in chronological order. Timelines often include labels indicating dates or times and may also include brief written descriptions. Typically, timelines show how something has changed over time or highlight key moments in the history of a person, group, object, or place. | 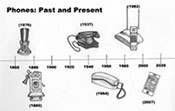 |
How can we teach about graphics in written text?
As noted earlier, there is very little research on how to teach elementaryage children to comprehend or compose graphics in or for informational text (for an exception, see McTigue & Flowers, 2011). We expect that this will be a burgeoning area of future research.
In the meantime, based on our experience as classroom teachers and the available research on young children’s interactions with written text and graphics, we have compiled 12 recommendations for teaching comprehension and composition of graphics in informational text at the elementary level. When applicable, we have also included one example of a standard from the CCSS that the recommended practice addresses (although many recommendations address more than one standard at more than one grade level).
Help children see that good readers read the graphics
Some children are under the impression that good readers do not need to look at the graphics to fully understand a text and thus avoid doing so (Norman, 2009), when, in fact, use of graphics is actually a mark of good readers (Hannus & Hyona, 1999). However, struggling and beginning readers do sometimes over rely on pictures to support word recognition (Beck & McKeown, 2001; Samuels, 1970), and in our experience, parents and teachers sometimes inadvertently discourage looking at graphics during reading in an effort to get children to attend more closely to the words. In light of these tendencies, it seems important that teachers seize every opportunity to comment explicitly on the value of graphics in constructing meaning from text and to model extracting and constructing meaning from graphics. (RIT.3.7: “Use information gained from illustrations [e.g., maps, photographs] and the words in a text to demonstrate understanding of the text.”)
Talk about graphics during read-alouds and shared reading
The techniques you use to explicitly teach about concepts of print or other literacy knowledge as you read with children (e.g., those described by Duffy, 2003; and Zucker, Ward, & Justice, 2009) can also be applied to teaching about graphics. Thinking aloud is one such technique that seems to improve comprehension of written text (e.g., Kucan & Beck, 1997).
For example, to draw attention to the purpose of a particular graphic, you could say something like, “Hmm. I’m noticing that the person who made this book put a diagram here. The words over here [running text] don’t talk about the parts of a bike, but this diagram tells me what they are called and where to find them. I’m learning something from the picture that I couldn’t learn from the words.” Later on, you might ask students to look carefully at the graphics in a text and reflect in similar ways. (RIT.K.3: “With prompting and support, describe the connection between two individuals, events, ideas, or pieces of information in a text.”)
Emphasize the concepts of importance and extension in talking about text
Given research indicating that some children struggle to identify the main ideas in print text (e.g., Schellings & Van Hout-Wolters, 1995) and our own research that doing so with graphics is also difficult, you will want to not only introduce but also reinforce the concept of importance. For example, you might take on the role of an “uninformed reader” (Duke, Caughlan, Juzwik, & Martin, 2011) by saying something that blatantly contradicts one of the concepts, such as insisting that, in a photograph of the African savanna captioned, “Savannas have a lot of grass and very few trees to block the sunlight from hitting the ground,” the most important component is a zebra standing in the background.
Similarly, to reinforce the concept of extension, when looking at a picture that clearly provides additional, interesting information about a given topic (beyond what is contained in the written text), you might say, “I think I’ll skip this picture and keep on reading because the words are where I’ll find all of the information.” Many students will jump at the opportunity to correct a teacher! However, be aware and adjust for those for whom this is culturally uncomfortable. (RIT.1.6: “Distinguish between information provided by pictures or other illustrations and information provided by the words in a text.”)
Have students read and write graphics for the same reasons people do outside of a schooling context
Students should read and write graphics not just to learn how to read and write them, practice reading and writing them, or satisfy a teacher’s assignment, but also because they actually want or need to obtain information from or convey information through them (Purcell- Gates, Duke, & Martineau, 2007). These kinds of literacy tasks can make reading and writing more compelling for students (Guthrie, McRae, & Klauda, 2007; Teale & Gambrell, 2007).
For example, a group of kindergarten through second-grade boys with whom Kathryn worked made detailed diagrams of animals’ body parts not simply because they were assigned to do so but because they were providing the diagrams and other information in field guides to be displayed for patrons at the city zoo. Similarly, to address both the CCSS on graphical literacy and content area standards, students could improve on an existing historical text by, for example, adding a timeline to help highlight key events (Duke, Halladay, & Roberts, 2013). (W.5.2: “Write informative/explanatory texts to examine a topic and convey ideas and information clearly… include formatting [e.g., headings], illustrations, and multimedia when useful to aiding comprehension.”)
Use books with clear, persuasive, and engaging graphics
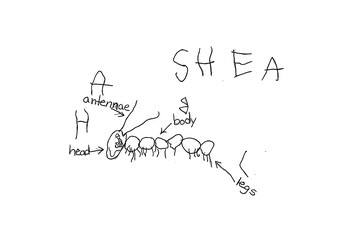
Show students that graphics can effectively support comprehension when the relationship between the written text and graphics is clear and synergistic (Dimino, 2007; Sipe, 1998) and that these texts can be models for their own composition. For example, you might share the flowchart and surface diagram from the book Honeybees (Heiligman, 2002), talking about how these vivid graphics draw the reader’s attention and convey meaning through their details. Children might then create their own lifecycle flowcharts or diagrams of insects or animals of their choice, as Shea (age 5) did (Figure 3).
Figure 3: A child’s diagram of a caterpillar
Using high-quality “mentor” texts provides clear models of what quality writing looks like, ripe for analysis and emulation by students and teachers (Galda & Cullinan, 2003; Kern, Andre, Schilke, Barton, & Mcguire, 2003), and can increase the quality of children’s own writing (Dressel, 1990). For suggestions for books with strong examples of specific kinds of graphics, see Table 3. (W.4.9: “Draw evidence from literary or informational texts to support analysis, reflection, and research.”)
Table 3: Possible texts to use when introducing each graphical device
| Graphical device | Suggested texts |
|---|---|
| Captioned graphics | Lions by Sally Morgan (additionally: flowcharts) Oceans: Properties and Living Things by Glen Phelan (additionally: tables) |
| Cross-sectional diagrams | The Busy Body Book: A Kid’s Guide to Fitness by Lizzy Rockwell Scary Creatures: Wolves by Penny Clarke |
| Flowcharts | Animal Look-Alikes by Rachel Griffiths and Margaret Cline (additionally: surface diagrams, maps, captioned graphics) See How It’s Made by Penny Smith and Lorrie Mack |
| Graphs | Animals in Danger: Leatherback Sea Turtle by Rod Theodorou (additionally: maps, tables) Math Curse by Jon Scieszka and Lane Smith |
| Insets | How Mountains Are Made by Kathleen Weidner Zoehfeld, (additionally: crosssectional diagrams) Under Your Feet by Marcia Gill (additionally: cross-sectional diagrams) |
| Maps | Desert Climate by Jasper Williams Jamaica: Immigration Today by Maya Logan (additionally: graphs) |
| Surface diagrams | Baseball by James Kelley (additionally: cross-sectional diagrams) Honeybees by Deborah Heiligman (additionally: flowchart) |
| Tables | Really Cool Reptiles Justin McCory Martin (additionally: captioned graphics) We Need Insects by Anna Prokos |
| Timelines | Inventing the Telephone by Sue Graves Soccer Around the World by Sandra Widener |
Discuss why the illustrator chose to include some specific graphical devices and not others
Just as we should talk with children about how the author’s word choices can make writing clearer or more interesting (e.g., Newman & Fink, 2012; Paquette, 2007), we should talk with children about how the illustrator’s graphical device choices can have an impact on text effectiveness. For example, when reading “What’s inside a wolf?” in Scary Creatures: Wolves (Clarke, 2004, p. 15) to fourth graders, Rebecca asked, “Why did the illustrator include the cross-sectional diagram of the wolf? What can you learn?” One student responded, “The heading goes with the picture… you can learn how an inside of a wolf’s body looks.” (RIT.4.7: “Interpret information presented visually, orally, or quantitatively [e.g., in charts, graphs, diagrams, timelines, animations, or interactive elements on Web pages] and explain how that information contributes to an understanding of the text in which it appears.”)
Have students plan the graphics in their own compositions
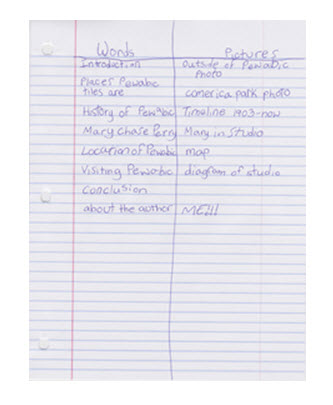
Research indicates that teaching students to plan for writing improves written products (e.g., Graham, Harris, & Mason, 2005). An important aspect of writing that students can plan for is the purposeful use of graphics. One planning strategy is to have students create tables of the information they want to convey and indicate the most appropriate device, if any, for each item. For an example of this type of table, see Figure 4. (W.4.2: “Write informative/ explanatory texts to examine a topic and convey ideas and information clearly… include formatting [e.g., headings], illustrations, and multimedia when useful to aiding comprehension.”)
Figure 4: A child includes graphical devices in planning her writing
Provide students with opportunities to give and receive feedback on the graphics they create
Just as providing opportunities for children to share their writing with peers and receive constructive feedback during conferences and “author’s chair” sessions can improve writing (e.g., Graham, Harris, & Mason, 2006; Stevens, Madden, Slavin, & Farnish, 1987), so too can providing opportunities to share graphics. As with peer feedback on written text, you will need to model this in advance and provide a good deal of scaffolding. For example, you might provide a list of questions for students to ask themselves about the graphics on which they are providing feedback (e.g., “Do the graphics appear to be accurate?” “Can you tell what meaning the author was trying to convey?”). (W.2.5: “With guidance and support from adults and peers, focus on a topic and strengthen writing as needed by revising and editing.”)
Pair students to read texts that include rich graphical devices
Partner reading, in which children discuss text with others and engage in asking and answering questions, leads to the social construction of meanings that are more in depth than any one reader could construct alone (e.g., Dole, Duffy, Roehler, & Pearson, 1991; Englert & Mariage, 1991) and can also improve overall independent comprehension (e.g., Mathes, Howard, Allen, & Fuchs, 1998). A logical extension of this practice is to include discussion of graphical elements. During reading, encourage children to discuss the information they are gleaning from the graphics, how they are constructing that meaning, and why the author chose to include particular graphics and not others. (RIT.3.7: “Use information gained from illustrations [e.g., maps, photographs] and the words in a text to demonstrate understanding of the text.”)
Group children by their graphical development needs
As noted earlier, there is likely to be a considerable amount of variation within grade in children’s acquisition of concepts of graphics and understanding of graphical devices (Duke, Roberts, & Norman, 2011; Duke et al., 2009). Research on other literacy skills suggests it is advisable to group children with similar instructional needs (e.g., Connor et al., 2011). Just as you might work with a small group of writers who all need to work on using cohesive ties or a small group of readers who all seem to need support with making inferences, so too might you work with a small group of students who, for example, all demonstrate an incomplete understanding of how to determine the most important part of a graphic or how to read a table.
Fill the classroom environment with graphics
Researchers have long recommended surrounding children with meaningful print at home and at school (e.g., Allington et al., 2010; Neuman & Roskos, 1992). Similarly, we believe it is important to surround children with high-quality graphical devices and to help children use those graphical devices in meaningful ways (e.g., preparing for recess by consulting a table that indicates ranges of outside temperatures, whether recess will be inside or outside, and appropriate clothing) and generally incorporate graphics into your classroom and daily routines as much as possible— not as decoration, but as frequently used resources.
Develop a schoolwide plan for teaching students to comprehend and compose graphics in text
This might include developing a common language to be used with students across grades (e.g., it is likely to be confusing to children if what some teachers call a table, others call a chart) and talking about what teachers will do with specific graphical devices at specific grade levels (e.g., kindergarten teachers might have students make timelines of their own lives, whereas fourthgrade teachers might engage students in making timelines of their state’s history). Strong evidence supports the idea that schoolwide, coordinated efforts to improve literacy instruction are an effective way to support literacy growth, particularly if those efforts are sustained for at least two years (Taylor, Pearson, Peterson, & Rodriguez, 2005).
The road ahead
For better or worse, the texts that young children encounter on a regular basis are likely to include a multitude of graphics, many of which carry meaning that cannot be gained from the text alone (Fingeret, 2012). However, many students have not acquired all concepts of graphics or developed a high level of proficiency in interpreting graphical devices, even by third grade. This makes it important for us to emphasize the value of graphics and to provide thoughtfully planned instruction in how to make meaning from graphics.
Preparing children to interpret graphical devices is challenging because the canon of devices that they are expected to interpret is a fast-moving target. Children are being presented with more and more digital, Web-based informational texts, which contain a myriad of new graphical devices, ranging from the fairly simple (e.g., captioned pictures that contain hyperlinks to additional information) to the dynamically complex (e.g., animated, interactive charts and graphs that allow the viewer to explore and transform presented data). We know very little about children’s abilities to understand and use such digital devices. More research is urgently needed on all types of graphical devices. In the meantime, we should use the research we do have to offer informed and engaging instruction.
Citation
Kathryn L. Roberts, Rebecca R. Norman, Nell K. Duke, Paul Morsink, Nicole M. Martin and Jennifer A. Knight (September 2013). Diagrams, Timelines, and Tables — Oh, My! Fostering Graphical Literacy. The Reading Teacher, 67(1), pp. 12-24
Reprints
For any reprint requests, please contact the author or publisher listed.