
One way to stimulate young minds is by creating and displaying information in chart and graph form. By creating simple bar or line graphs, children learn to ask questions and gather information about themselves and their surroundings. They also learn to sort and organize objects based on information. Last, young children can represent this information using real objects, pictures, and graphs.
Bar graphs are simple graphs in which the height of each bar provides information. Bar graphs use a few vocabulary words that help us understand the information in the graph.
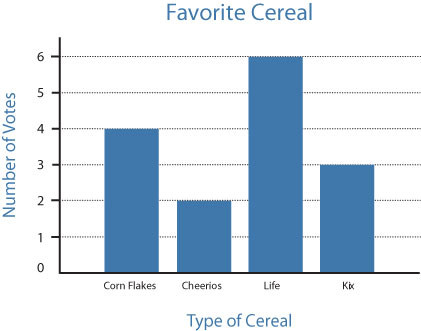
- The graph title helps us know what information we can find on the graph. The graph title is usually found at the top of the graph. Our sample bar graph’s title is Favorite Cereal.
- The axes are the two sides of the graph. The vertical axis runs goes from top to bottom. The horizontal axis runs along the bottom of the graph.
- The axes labels tell us what information is presented on each axis. In our sample graph, one axis is Type of Cereal. The other is Number of Votes.
- The scale tells us how many or how much. In our example, the scale uses the numbers 1, 2, 3.
- The bar height tells us the value of each option. In our example, the height of the bars tells us how many people voted for each cereal.
Young children will love to create graphs based on all sorts of information. Some examples of graphs to create include: number of socks by color, favorite ice cream flavor, number of teeth lost, favorite thing to have for lunch.
As an alternative to paper-based graphs, have children use a large sheet of paper. Draw some simple grid lines, and ask children to real objects, rather than a drawn bar, to display the information. For example, have your child lay out their socks by color, or line up bowls to show favorite foods.
Once a graph is created, ask your child to “read” the graph. What is the title of our graph? What information does each side tell us? Which item had the most votes? Which item had no votes? Can you list the items from most votes to least votes?
Graphs are widely used in math and science. Helping your child learn how to gather, organize, and share information using a graph is a great way to prepare them for success in school.
Recommended children’s books

The Great Graph Contest
Age Level:
6-9 Published:
2006

Lemonade for Sale
Age Level:
6-9 Published:
1998

Tally O’Malley
Age Level:
6-9 Published:
2004

Tiger Math: Learning to Graph from a Baby Tiger
Age Level:
6-9 Published:
2002
Download this article(opens in a new window)
Download this article in Spanish(opens in a new window)
View this article in Spanish(opens in a new window)
Subscribe to Growing Readers!
Get our free monthly parent tips — in English and Spanish — delivered right to your inbox!
Reprints
You are welcome to print copies or republish materials for non-commercial use as long as credit is given to Reading Rockets and the author(s). For commercial use, please contact [email protected].