
A kindergarten teacher plans to teach science as inquiry and life science, specifically as it relates to butterflies. To engage her young students, she first reads “The Very Hungry Caterpillar,” by Eric Carle, aloud, and after a discussion, she asks them to complete a sentence frame from the book about the hungry little caterpillar: “On Monday he ate through one apple … ” She records what each student says on a language experience chart.
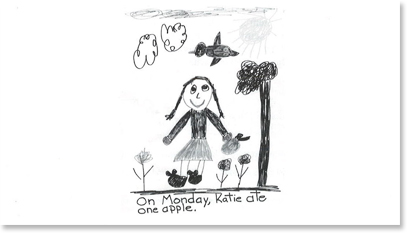
Kate says: “On Monday, Kate ate one apple.” Kate draws a picture of this and her teacher writes what she recorded on the chart on the picture. The students’ responses and pictures are made into a book called “The Very Hungry Kindergarten Class.” With many books on butterflies in the classroom, the students co-create a descriptive model chart of a butterfly with their teacher.
Rationale
A graphic organizer is a strategy for science instruction that teachers can use to help students record information from direct observation as well as from reading in order to create a descriptive model of an organism or a phenomenon. Graphic organizers are visual illustrations of concepts, information, and verbal statements. They can take many forms useful in teaching inquiry process skills in science: descriptive feature charts, T-charts, flow charts, Venn diagrams, tree diagrams, and semantic maps, among others. Graphic organizers provide a picture of key ideas and information on a topic and the relationship of the parts to the whole. Furthermore, research showed that when students constructed their own graphic representation of material in an explanatory text, theyshowed better understanding than those who copied an illustration or wrote a summary (Edens & Potter, 2003; Gobert & Clement, 1999; Tomkins & Tunnicliffe, 2001).
When fiction and nonfiction books are integrated into the teaching of a content area such as science, graphic organizers are useful for organizing information and enabling students to classify observations and facts, comprehend the relationships among phenomenon, draw conclusions, develop explanations, and generalize scientific concepts. For example, an important inquiry process skill is comparing. It is a way of creating order from gathering observations from the natural world and making sense of scientific information that has been read. A teacher can use a T-chart to teach this skill. A T-chart is in the shape of the letter T, with a horizontal line at the top to signify a broad category and a vertical line that allows students to compare attributes of a concept, organism, or phenomenon.With a topic as the title on the horizontal line, students compare two aspects of the topic on each side of the vertical line. These can be mutually exclusive, such as comparing mammals and non-mammals or insects and spiders, or they can compare two types of spiders with different characteristics.
Charts and other graphic organizers have been found to be effective with students who are struggling with learning content at their grade level or who have difficulty learning (Guastello, Beasley, & Sinatra, 2000). To use charts effectively, Baxendell (2003) offered the following research-based recommendations:
- Use charts consistently. For example, each time that a process with steps is taught, use a flow chart.
- Make sure charts clearly show the relationship among key concepts, words, and ideas on a topic. Use clear labels.
- Be creative when using charts across a lesson or unit in science and across content areas.
For example, a chart can be used to introduce a topic after reading a book to activate students’ prior knowledge and background experiences, to later clarify problem areas and analyze and synthesize concepts, and, finally, to help students communicate and review what they have learned.
Strategy
Introduce and model the use of graphic organizers as a strategy for inquiry-based, discovery-focused science. Students can learn to organize and analyze observations from the natural world, such as of organisms or objects, but they can also use information from books to begin using charts and to complement and supplement first-hand observations.
Choose, read aloud, and lead discussions on one or more books about living organisms or other topics using reader response questions and prompts to engage students and connect to their experience of the book and prior knowledge. Ask students to describe what they learned from the reading, discussion, and observation of illustrations, photographs, diagrams, charts, maps, and other graphic representations in a book. Then, model how to organize and record the information on various types of charts to classify, clarify, compare, analyze, and interpret it.
The features of an organism can be displayed on a descriptive feature chart with a horizontal and vertical axis to develop a descriptive model of the organism, such as a butterfly. A T-chart can be used to identify differences among organisms, such as insects and spiders or mammals and non-mammals, by placing one on the left side of the vertical line on and the other on the right side. Flow charts can be used to build a descriptive model of the life cycle of an organism.
After modeling the use of a graphic organizer with a class and engaging them in its development, students can practice using it in pairs, groups, or individually. They can come together again as a class to discuss what they have discovered. Students can also use graphic organizers to communicate to others what they have learned, especially if a class is divided into groups with each group studying a different aspect of a science topic or problem using the jigsaw approach. Finally, graphic organizers are also useful toolsfor students to review a topic, and they can be used for assessment purposes. This same strategy can be used with observations of real world phenomena after modeling with literature.
Graphic organizers produced by students can be displayed as posters in the classroom, as a page in a student-written book, on an overhead projector transparency or in a PowerPoint presentation, or in an online blog on a topic to communicate and clarify for others what the students have discovered.
Technology
Many online sources provide information about charts and other graphic organizers, including how to use them across the K through 8 curriculum, and also offer free, printable versions that students can use on their own after a topic in science has been introducedthrough literature, class discussions, and modeling using student ideas and responses:
Grade-level modifications
K–2nd Grade
Eric Carle’s (1986) classic picture book The Very Hungry Caterpillar is often read aloud by teachers in the primary grades because of its engaging narrative and captivating illustrations. It’s an ideal book for students to read along with the teacher using the illustrations as clues to making predictions for reading comprehension. Teachers also use it for several other instructional purposes: learning the names of the days of the week in sequence, reviewing the names of various foods, counting, and learning aboutthe life cycle of a caterpillar as it turns into a butterfly.
After reading aloud, ask reader response questions tapping into students’ own experiences:
- What food do you like to eat?
- What is a day that you ate it?
- How many did you eat?
Record student responses in a sentence frame on a language experience chart: “On (day of the week) (name of child) ate (number) (food).” Students can then draw a picture of themselves eating the food and copy their sentence from the language experience chart onto the picture as a caption. These can be bound into a class book titled The Very Hungry Kindergarten (or other grade) Class.
Collect a text set of other books on caterpillars and butterflies to read aloud or for students to look at or read on their own, with an adult, in pairs, or in groups. Students can also observe a butterfly specimen, watch butterflies hatch from eggs that can be ordered from a biological supply company, and view images and videos of butterflies online.
Then, use a chart that organizes the characteristics of a butterfly to build a descriptive model of an organism.
Descriptive Feature Chart for a Butterfly
| Body Parts | Number | Color and Shape | Position | Appearance |
|---|---|---|---|---|
| Antennae | 2 | Black, straight line | On head | Thin |
| Head | 1 | Black, round | Front of thorax | Tiny, big eyes |
| Thorax | 1 | Red and black, oval | Behind head | Bigger than head |
| Abdomen | 1 | Yellow, long oval | Behind thorax | Black dots, 8 parts |
| Legs | 6 | Black, straight line | Attached to thorax | 4 long, 2 short |
| Wings | 2 | Yellow and black, curve | Attached to thorax | Large, colorful |
As a whole class, in pairs, small groups, or on their own, students can use the descriptive feature chart to write a description of a butterfly, summarizing, analyzing, and interpreting what they observed, organized, and classified on the chart.
Recommended children’s books
Allen, J. (2000). Are you a butterfly? New York: Kingfisher.
Bishop, N. (2009). Butterflies and moths. New York: Scholastic
Bunting, E. (1999) Butterfly house. New York: Scholastic.
Carle, E. (1986). The very hungry caterpillar. New York: Philomel.
Gibbons, G. (1989). Monarch butterfly. New York: Holiday House.
Lerner, C. (2002). Butterflies in the garden. New York: HarperCollins.
Swinbourne, S. (2006). Wings of light: Butterfly migration. Honesdale, PA: Boyds Mills Press.
Swinbourne, S. (2009). A butterfly grows. Boston: Houghton Mifflin Harcourt.
Wallace, K. (2000). Born to be a butterfly. London: Dorling Kindersley.
Zemlicka, S. (2003). From egg to butterfly. Minneapolis, MN: Lerner.
3rd Grade–5th Grade
Introduce students to the classification of animals and the diversity that exists among different types of animals. A good fiction book to read aloud is Animalia, by Graeme Base (1986), a beautifully illustrated animal alphabet that uses alliteration, such as “Lazy lions lounging in the local library.” Students are invited to identify all the things that start with the letter L on that page. Follow the reading with a discussion and reader response questions:
- What do you know about any of the animals in the book?
- What experiences have you had with any animal?
Then read the nonfiction book What Is the Animal Kingdom? by Barbara Kalman (1998), leading into students reading from a text set of books on different animals and discussing the books in small groups or book clubs. Students can take notes in a science journal or take notes for them during a discussion with each of the book clubs.
To model the use of the T-chart, read two other books by Barbara Kalman, What Is a Vertebrate? (2007) and Animals Without Backbones (2008), and have students list the types of each on the chart. Characteristics of these two types of animals can also be added to the list, including examples of each that they read about in book clubs.
T-Chart: Animals
| Vertebrates (5 main groups) | Invertebrates (6 main groups) |
|---|---|
| Mammals | Mollusks (0 legs) |
| Birds | Annelids (0 legs) |
| Reptiles | Insects (6 legs) |
| Birds | Arachnids (8 legs) |
| Fish | Myriapods (20+ legs) |
| Crustaceans (10–14 legs) | |
| Examples | Examples |
As students continue to read, characteristics, descriptions, and examples are added to the T-chart; it can reveal the differences, connections, and relationships among these types of living organisms. In small groups, book clubs, or individually, students can do their own T-charts comparing any two vertebrates or invertebrates, or two examples of any type of animal.
Technology
Use an interactive learning site, which includes games and activities based on a PBS television series using Animalia(opens in a new window). The CGI-animated television show and the website feature two 11-year-old children who have adventures with the animal characters from the book. There is also a PBS DVD based on this series: Animalia: Welcome to the Kingdom.
Websites to visit for more information include Animal Diversity(opens in a new window) and Bio Kids(opens in a new window).
Recommended children’s books
Arnosky, J. (2009). Crocodile safari. New York: Scholastic.
Base, G. (1986). Animalia. New York: Henry N. Abrams.
Kalman, B. (1997). What is a mammal? New York: Crabtree.
Kalman, B. (1998). What is a bird? New York: Crabtree.
Kalman, B. (1998). What is a fish? New York: Crabtree.
Kalman, B. (1998). What is a reptile? New York: Crabtree.
Kalman, B. (1998). What is the animal kingdom? New York: Crabtree.
Kalman, B. (2000). What is an amphibian? New York: Crabtree.
Kalman, B. (2002). What is an arthropod? New York: Crabtree.
Kalman, B. (2007). What is a vertebrate? New York: Crabtree.
Kalman, B. (2008). Animals without backbones. New York: Crabtree.
Kelly, I. (2009). Even an ostrich needs a nest: Where birds begin. New York: Holiday House.
Momatiuk, Y., & Eastcott, J. (2009). Face to face with penguins. Washington, DC: National Geographic Children’s Books.
Nichols, M. (2009). Face to face with gorillas. National Geographic Children’s Books.
Parker, S. (2004). Insect. New York: DK.
Siwanowicz, I. (2009). Animals up close. New York: DK.
Stewart, M. (2009). A place for birds. Atlanta, GA: Peachtree.
English language learners
Use the visual information in illustrations, photographs, diagrams, charts, and models in books to make content about a living organism comprehensible to English language learners. Tapping into their prior knowledge of any of the organisms supports their learning by relating instruction to their past experiences. The use of real living organisms, specimens, or models is important to provide direct experiences to enhance academic instruction in science as well as in English learning.
Students creating their own charts — either as a whole class, in a pair with a more capable English speaking peer, or in small groups — is especially helpful when teaching content to English language learners. Bilingual books, such as the title that follows, on living organisms can provide primary language support as well.
Kalman, B. (2005). Que es el reino animal? What is the animal kingdom? (Spanish Edition). New York: Crabtree.
Technology
See the website ProTeacher(opens in a new window) for ayudas graficas, graphic organizers written in Spanish.
Struggling students
Make a copy of a chart for each student that matches the chart he or she will use to model with the whole group or class. While writing down what students say on the group or class chart, also take dictation for individual students who can use the groupor class chart for ideas. The chart can also include a word bank of the key vocabulary for the content of each chart, which students can use to help them remember the appropriate words when recording their ideas. The word bank of key vocabulary can also be written on index cards, with a set of cards made for each student or small group. Students can place the key words on the chart and move them to identify relationships before they write them down. Sticky notes can also be used for this purpose.
Assessment
Successful completion of a chart that displays what students have observed through direct experiences with an organism or information they have discovered in books is one way to assess the use of charts in science instruction. A rubric could be cocreated with students to assess each element of the chart, such as appropriate placement of information, accuracy of information, and amount of detail provided.
Students could also write a summary and conclusion of what they learned from the chart as a means of assessment. Since charts can be used to communicate information to others, students could be assessed on a presentation to the class or a group using the chart.
Resources
Bellanca, J. (2007). A guide to graphic organizers (2nd ed.). Thousand Oaks, CA: Corwin Press.
Burke, J. (2002). Tools for thought: Graphic organizers for your classroom. Portsmouth, NH: Heinemann.
Chang, M. L. (2006). Science graphic organizers and mini-lessons. New York: Scholastic.
Tate, M. L. (2007). Engage the brain: Graphic organizers and other visual strategies, science. Thousand Oaks, CA: Corwin Press.
Citation
Cox, C. (2012). Literature Based Teaching in the Content Areas. Thousand Oaks, CA: SAGE Publications, Inc.
Reprints
For any reprint requests, please contact the author or publisher listed.